Additional Analysis
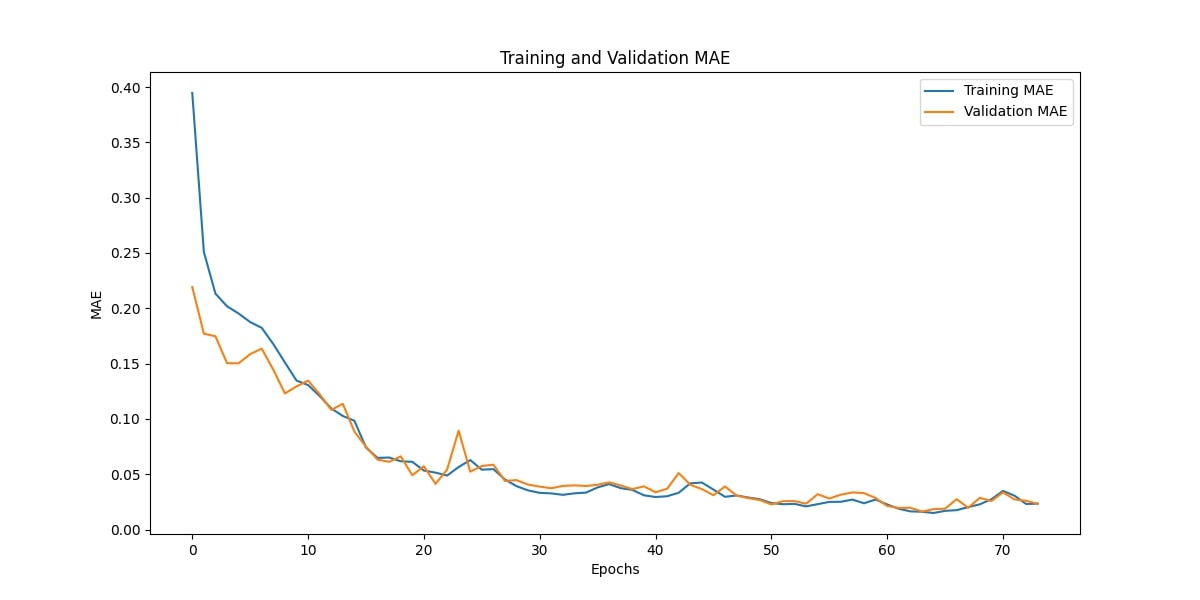
Training and Validation MAE
The plot demonstrates the Mean Absolute Error (MAE) trends for both the training and validation sets across epochs. Initially, both curves exhibit higher MAE values, indicating greater prediction errors, but they rapidly converge and stabilize as the model learns from the data. The validation MAE closely follows the training MAE without significant divergence, suggesting minimal overfitting and strong generalization to unseen data.
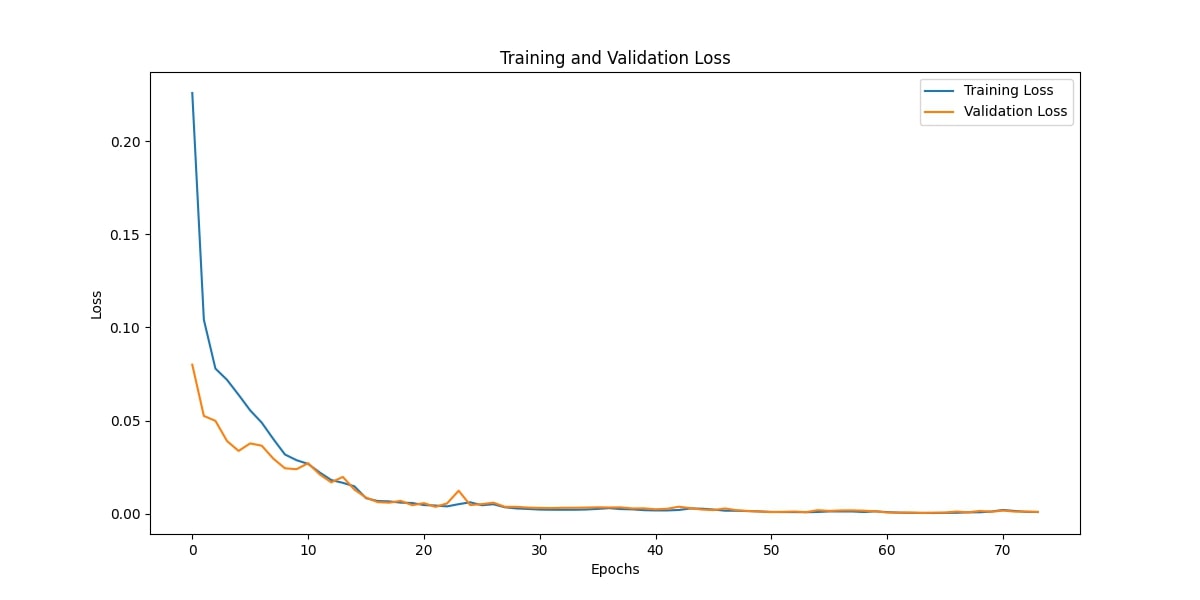
Training and Validation Loss
The loss curves indicate the progression of the model's learning process. Both training and validation losses decline steeply in the early epochs and plateau as the model converges. The near-parallel nature of the curves and their stabilization at similar levels highlight that the model effectively balances fit and generalization. The absence of divergence between training and validation loss reaffirms that the model avoids overfitting.
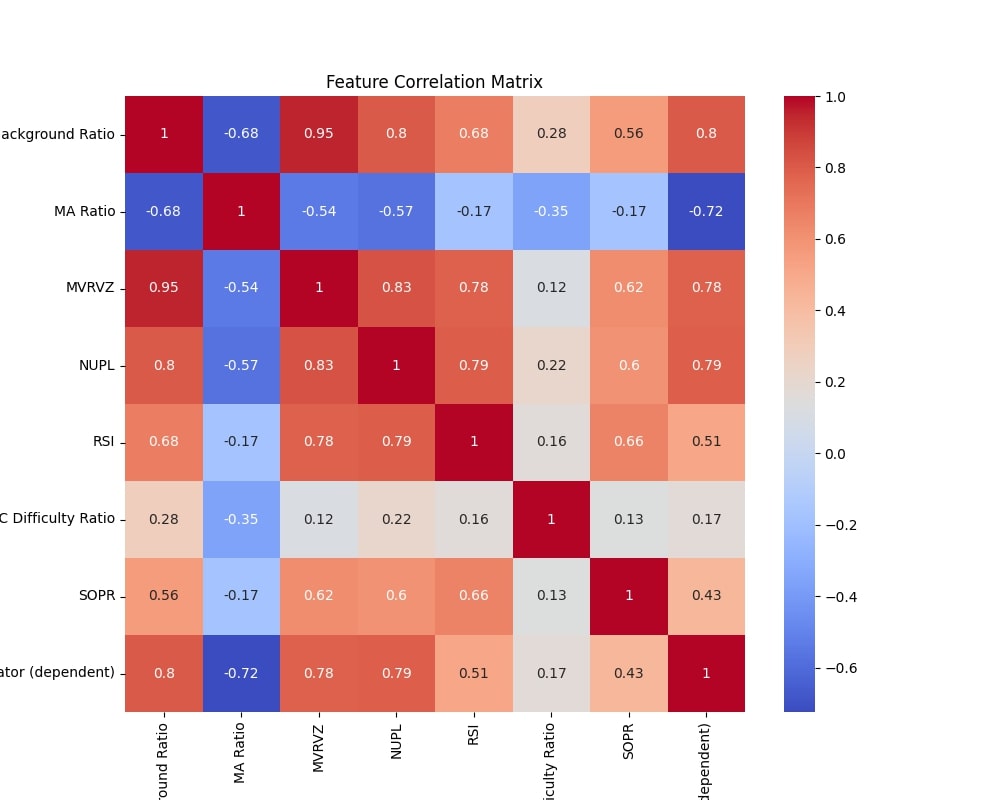
Feature Correlation Matrix
High positive correlations (e.g., MVRVZ, NUPL) suggest that these variables significantly influence the dependent variable, while negative correlations (e.g., MA Ratio) provide insights into inversely related factors. The matrix validates the feature selection process by confirming that the selected variables capture diverse and meaningful relationships with the target. It also highlights potential multicollinearity (e.g., high correlations between Shifted CVDD Background Ratio and MVRVZ), which the LSTM architecture handles well.
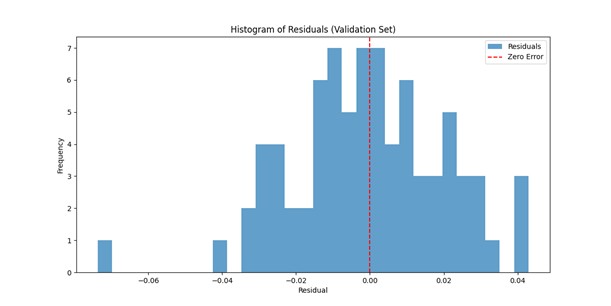
Historigram of Residuals (Validation Set)
The symmetric, bell-shaped curve centered around zero suggests that the residuals are approximately normally distributed, as confirmed by the Shapiro-Wilk and Kolmogorov-Smirnov tests. The absence of significant skewness or extreme outliers indicates that the model produces unbiased predictions with errors distributed evenly.
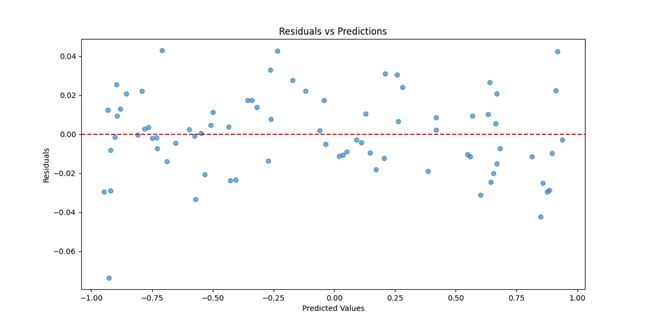
Residuals vs Predictions
The scatterplot of residuals against predictions confirms the absence of systematic bias in the model’s predictions. The residuals are randomly scattered around the zero-error line, with no discernible patterns or trends, suggesting that the errors are independent of the predictions. This supports the validity of the model and ensures that no key relationships in the data were overlooked during training.
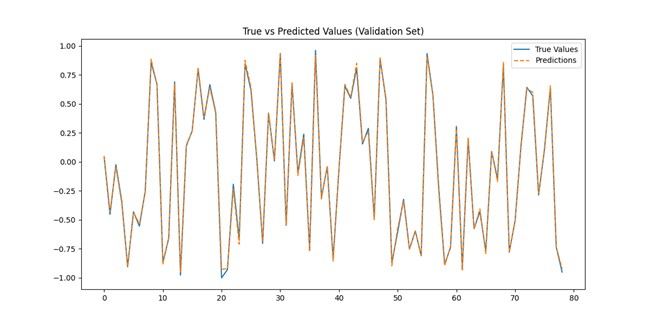
True vs Predicted Values (Validation Set)
This graph compares the true values of the dependent variable with the model’s predictions for the validation set. The near-perfect overlap of the predicted curve (dashed line) with the true values indicates that the model effectively captures the underlying patterns in the data. The minor deviations suggest small residual errors, which are expected but remain well within acceptable ranges.